Project
On
Digitalizing Sylhet City Corporation with GIS
Introduction
This project is based on analysis and implementation of GIS (Geographic Information Systems) for Sylhet City Corporation. Main focus is to study on existing map and field analysis. Than convert it into digital form.
After collecting small parts of map, we merged them up according to valid Longitude and Latitude. We were trying to figure out the distance between the university within the City Corporation area. Our analysis is focused on comprising the people and university ratio. By using GIS we can forecast how much university is required in future to support growing population.
Geographic information refers to geographically referenced data or information, i.e. data identified according to their locations, also referred to as spatial data. Through formal definition, GIS is “…a computer based information system designed to support the capture, management, manipulation, analysis, modeling, and display of spatially referenced data for solving complex planning & management problems”
Why Use GIS?
Because everything we manage is somewhere:
Roads Zoning
Zip Codes Flood Zones
Census Tracts Rivers & Lakes
Voting Precincts Shopping Centers
Criminal Activity Property Addresses
Water Service Areas Customer
Addresses Emergency Services
Solid Waste Routing ... and somehow connected.
Components of a GIS
A GIS consists of the following components:
(1) Data: an input system that allows for the collection of data to be used and analyzed for some purpose;
(2) Hardware and Software: computer hardware and software systems that store the data, allow for data management and analysis, and can be used to display data manipulations on a computer monitor;
(3) People/ Humanware: Range from technical specialist who design and maintain the system to those who use it to help them perform their everyday work.
(4) Method/ procedure: A successful GIS operates according to a well-designed plan and business rules.
(5) Network/Internet:
(6)Output: an output system that generates hard copy maps, images, and other types of output.
Factors aiding the rise of GIS.
Revolution in Information Technology.
o Remote Sensing.
o Global Positioning System.
Communication Technology.
Rapidly declining cost of Computer Hardware, and at the same time, exponential growth of operational speed of computers. Enhanced functionality of software and their user-friendliness. Visualizing impact of GIS corroborating the Chinese proverb "a picture is worth a thousand words" Geographical feature and data describing it are part of our everyday lives & most of our everyday decisions are influenced by some facet of Geography.
Answers GIS can give
Till now GIS has been described in two ways:
1. Through formal definitions, and
2. Through technology's ability to carry out spatial operations, linking data sets together.
However there is another way to describe GIS by listing the type of questions the technology can (or should be able to) answer. Location, Condition, Trends, patterns, Modeling, Spatial questions. There are five types of questions that a sophisticated GIS can answer:
Location What is at………….?
The first of these questions seeks to find out what exists at a particular location. A location can be described in many ways, using, for example place name, post code, or geographic reference such as longitude/latitude or x/y.
Condition Where is it………….?
The second question is the converse of the first and requires spatial data to answer. Instead of identifying what exists at a given location, one may wish to find location(s) where certain conditions are satisfied (e.g., an unforested section of at-least 2000 square meters in size, within100 meters of road and with soils suitable for supporting buildings)
Trends What has changed since…………..?
The third question might involve both the first two and seeks to find the differences (e.g. inland use or elevation) over time.
Patterns What spatial patterns exists…………..?
This question is more sophisticated. One might ask this question to determine whether landslides
are mostly occurring near streams. It might be just as important to know how many anomalies
there are those do not fit the pattern and where they are located.
Modelling What if……………..?
"What if…" questions are posed to determine what happens, for example, if a new road is added
to a network or if a toxic substance seeps into the local ground water supply. Answering this type
of question requires both geographic and other information (as well as specific models). GIS
permits spatial operation.
A-spatial Questions
"What's the average number of people working with GIS in each location?" is an a spatial question- the answer to which does not require the stored value of latitude and longitude; nor does it describe where the places are in relation with each other.
Spatial Questions
" How many people work with GIS in the major centres of Delhi" OR " Which centres lie within10 Kms. of each other? ", OR " What is the shortest route passing through all these centres".These are spatial questions that can only be answered using latitude and longitude data and other information such as the radius of earth. Geographic Information Systems can answer such questions.
Advantages of GIS
The Geographic Information System has been an effective tool for implementation and monitoring of municipal infrastructure. The use of GIS has been in vogue primarily due to the advantage mentioned below:
Planning of project
Make better decisions
Visual Analysis
Improve Organizational Integration
Planning Of Project
Advantage of GIS is often found in detailed planning of project having a large spatial component, where analysis of the problem is a pre requisite at the start of the project. Thematic maps generation is possible on one or more than one base maps, example: the generation of a land use map on the basis of a soil composition, vegetation and topography. The unique combination of certain features facilitates the creation of such thematic maps. With the various modules within GIS it is possible to calculate surface, length, width and distance.
Making Decisions
The adage "better information leads to better decisions" is as true for GIS as it is for other information systems. A GIS, however, is not an automated decision making system but a tool to query, analyze, and map data in support of the decision making process. GIS technology has been used to assist in tasks such as presenting information at planning inquiries, helping resolve territorial disputes, and sitting pylons in such a way as to minimize visual intrusion.
Visual Analysis
Digital Terrain Modeling (DTM) is an important utility of GIS. Using DTM/3D modelling, landscape can be better visualized, leading to a better understanding of certain relations in the landscape. Many relevant calculations, such as (potential) lakes and water volumes, soil erosion volume (Example: landslides), quantities of earth to be moved (channels, dams, roads, embankments, land leveling) and hydrological modeling becomes easier. Not only in the previously mentioned fields but also in the social sciences GIS can prove extremely useful. Besides the process of formulating scenarios for an Environmental Impact Assessment, GIS can be a valuable tool for sociologists to analyze administrative data such as population distribution, market localization and other related features.
Improving Organizational Integration
Many organizations that have implemented a GIS have found that one of its main benefits is improved management of their own organization and resources. Because GIS has the ability to link data sets together by geography, it facilitates interdepartmental information sharing and communication. By creating a shared database one department can benefit from the work of another--data can be collected once and used many times. As communication increases among individuals and departments, redundancy is reduced, productivity is enhanced, and overall organizational efficiency is improved. Thus, in a utility company the customer and infrastructure databases can be integrated so that when there is planned maintenance, affected people can be informed by computer-generated letters.
Map is a reduction of reality of the real world. It represents geographic features or other spatial phenomena by graphically conveying locational and attribute information . Locational information describes the position of particular geographic features on the Earth's surface, as well as the spatial relationship between features, such as the shortest path from Metropolitan University Campus to a fire station, the proximity of competing businesses, and so on.
Attribute information describes characteristics of the geographic features represented, such as the feature type, its name or number and quantitative information such as its area or length. Basic objective of mapping
To provide
- descriptions of geographic phenomenon
- spatial and non spatial information
- map features.
Map Features
Point feature
A point feature represents as single location. It defines a map object too small to show as a linear
area feature. A special symbol of label usually depicts a point location.
Line feature
A line feature is a set of connected, ordered coordinates representing the linear shape of a map object that may be too narrow to display as an area such as a road or feature with no width such as a contour line.
Area feature
An area feature is a closed figure whose boundary encloses a homogeneous area, such as a state country soil type or lake.
Map Characteristics
Map Scale
Map Accuracy
Map Extent and
Data Base Extent
Developing GIS
At the very beginning we collected map’s from google. A thorough land survey was needed to collect the real information. We’ve walked and collected all the information as much we could. From the google map, the slice of map was generated by adobe Photoshop. The slices are given bellow:

Figure: Slice 1 (central view)

Figure 2: Slice 2

Figure 3: Slice 3

Figure 4: slice 4

Figure 5: Slice 5

Figure 6: slice 6

Figure 7: Slice 7
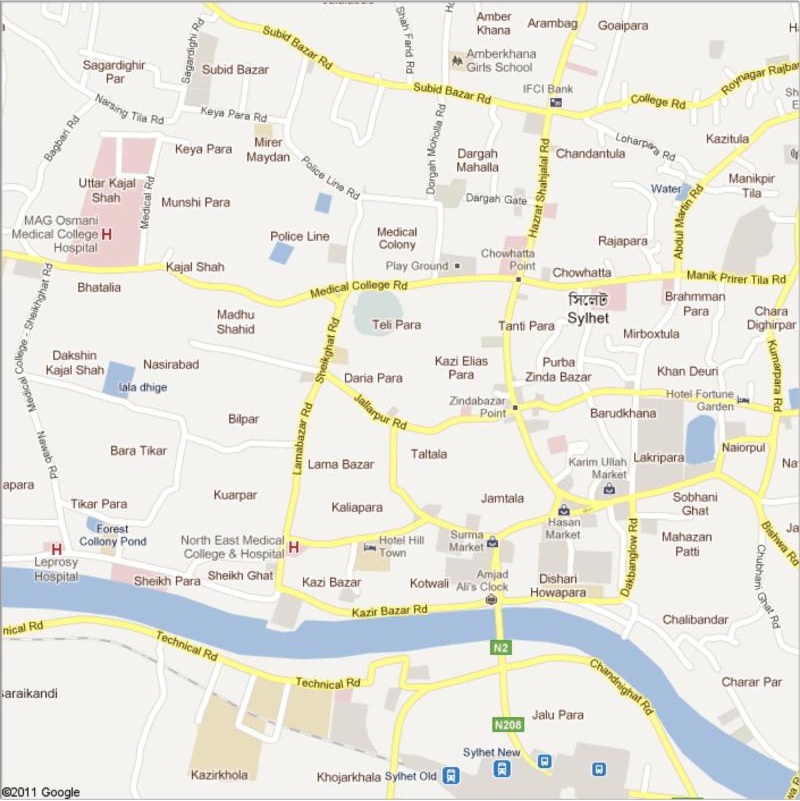
Figure 8: Slice 8
After collecting the slices, we used the transparency tool from Photoshop, and Marge them layer by layer. This process took long time as because the map accuracy is a major fact. The successful migration of slices is shown bellow-

Figure: Sylhet City Corporation

Sylhet City Corporation
After mixing all the slice image, we found a complete map of Sylhet city corporation..
Review
As walking with the growing technology, we should move forward to digitalization. Sylhet City
Corporation needs to have a digital version of their map. We have collected and verified the
geo-referenced information from Sylhet City Corporation, LGED through field survey.
Our main aim was to focus on the academic and medical sector of the city corporation.
Further development of the map could enhance the quality of query among the area. This digital
version of map can help us to the following factor -
• Map revisions will be faster and easier.
• Communities can incorporate the digital flood map data with local data,
• Letters of Map Change (LOMCs) can be incorporated on the digital map on a more frequent basis than in the past. Once incorporated, the community may print the revised map rather than have separate pages of copied LOMCs.
• We are capable to have the Accurate Directions
• Most digital map allows us to retrace our steps by pressing a few buttons. If our traditional map is overly used, this task could be quite difficult.
• No need to ask for directions. A digital map identifies your current, exact location if you happen to get lost.
• By entering the name of your desired location (for example, a specific address or business) in the search field, a digital map provides a list of possible locations. we can select the location that meets your needs.
If we want to find out the university and college list from the map, we can easily get it.


Figure: College and University inside the Sylhet City Corporation
References
http://dnr.state.il.us/flood/Advantages.htm
http://www.ehow.com/facts_5526009_advantages-digital-maps.html
http://www.tomtom.com/howdoesitwork/page.php?ID=10&CID=3&Language=1
http://www.sylhetcitycorporationbd.com/aboutsylhet.htm
http://www.google.com/url?sa=t&source=web&cd=5&ved=0CEIQFjAE&url=http%3A%2
F%2Flinfiniti.com%2Fdla%2Fworksheets%2F5_RasterData.pdf&ei=UMplTqPINsbYrQe
KovGkCg&usg=AFQjCNEuJQPogdWiNay_xHF_BiNafGRfaw
Click bellow to download pdf file